LogiNext
Stop Duration Intelligence

Service Time Analytics

Where Every Minute Becomes a Competitive Advantage

The real story of fleet efficiency isn't written on the road. It's written at every stop.

The moment a driver arrives at a customer location, the clock starts ticking. Loading. Waiting. Searching for parking. Customer coordination. Multiply those minutes by thousands of deliveries a day, and suddenly operational efficiency becomes a time-management problem.

LogiNext's Service Time Analysis transforms every stop into actionable intelligence, revealing exactly where time is gained, lost, or wasted.

0%productivity improvement
0.9%visibility into delays
0yrhistorical analytics
Service Time AnalyticsPlanned vs Actual

Why Service Time Analytics Is a Strategic Priority?

In enterprise logistics, visibility cannot end at the vehicle location. Without Stop Duration Intelligence, organizations face a silent productivity killer:

Hidden On-Site Delays

Drivers spending longer than expected without operational visibility.

Inaccurate Route Planning

Routes planned based on assumptions rather than real service-time data.

Missed Delivery Windows

One delayed stop cascading into multiple SLA violations.

Inconsistent Operational Standards

Different regions and drivers performing the same job in completely different timeframes.

The result? Lost productivity. Missed promises. Rising operational costs.

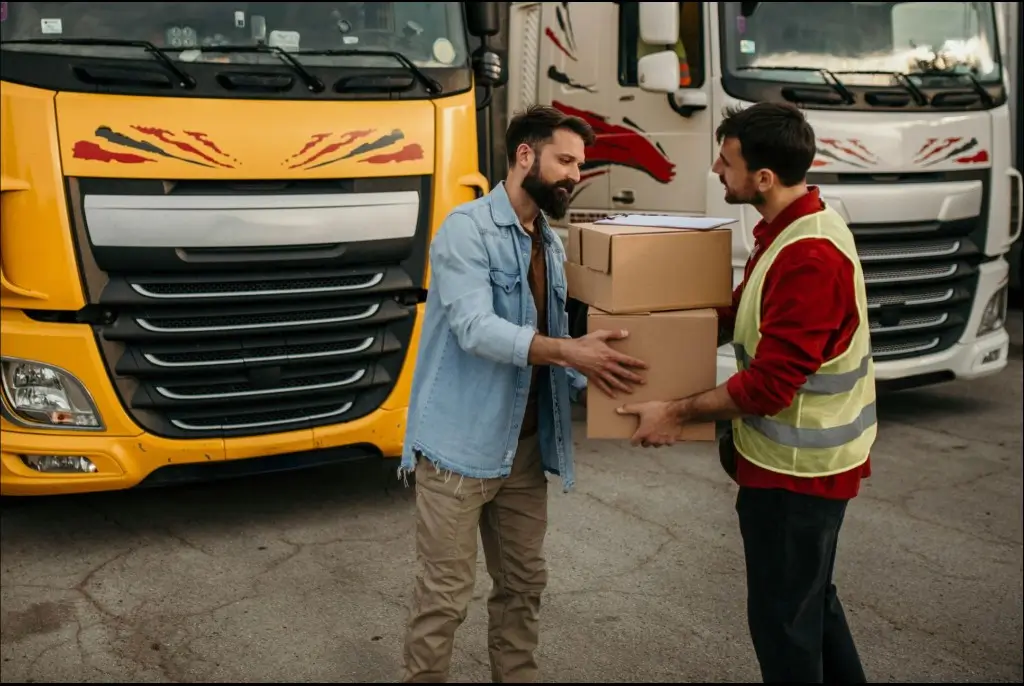
Logistics handover at a stop — driver and recipient exchanging packages; service time is measured from check-in to check-out at each location

From Guesswork to Precision: A Real Example

A global distribution company discovered a 20% gap between planned and actual service times. Using LogiNext's Driver Stop Efficiency Analytics, they uncovered the cause: large retail locations required longer unloading and documentation cycles than their planning models assumed.

Before

20% gap between planned and actual

  • Manual reporting and estimates
  • Large retail locations took longer than planned
  • Unloading and documentation cycles not in planning models

After

Planning profiles updated with real data

  • 📈 Service time dropped by 15%
  • 🚚 Delivery reliability improved significantly
  • ⏳ Schedules became realistic and achievable

How Service Time Analytics Works

Turning Driver Activity into Operational Intelligence

Precise Check-In Capture

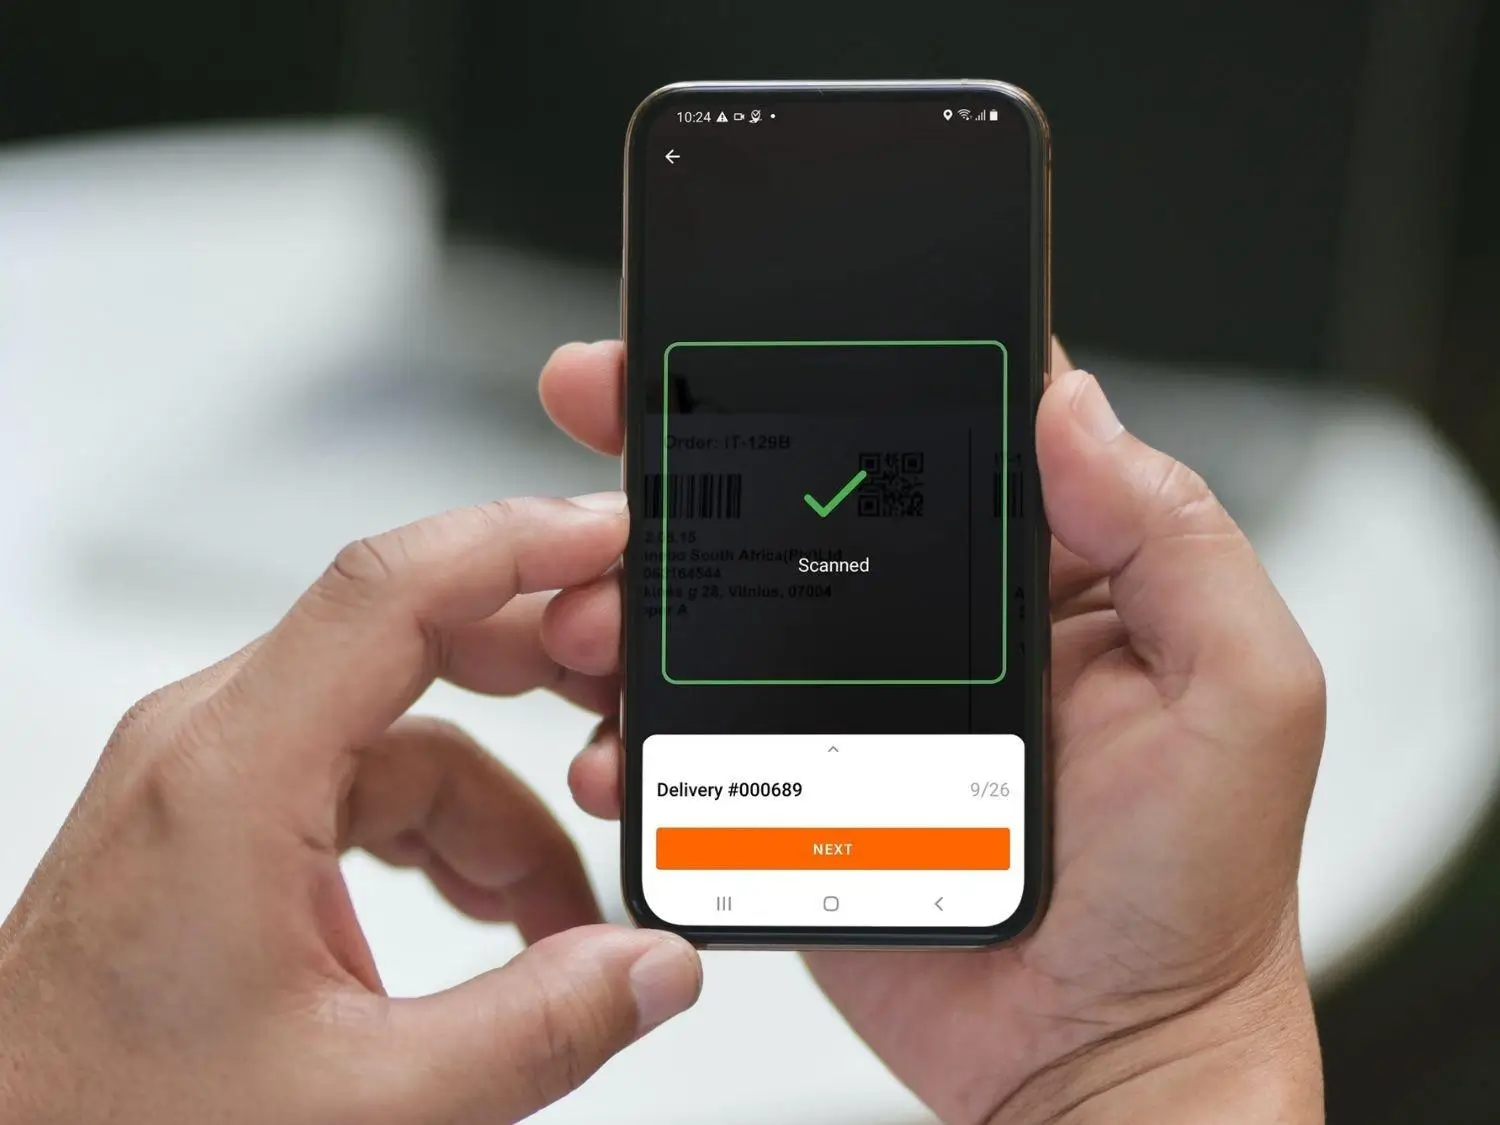
The exact moment a driver arrives is recorded when they swipe Check-In in the LogiNext Driver.

Smart Check-Out Tracking

The system logs the moment the driver completes the job—Delivered, Picked Up, or Attempted.

Instant Service Time Calculation

AI calculates the exact duration between check-in and check-out. No estimates. No assumptions.

Planned vs Actual Intelligence

Actual service time is automatically compared against Planned Service Time from your planning profile.

Deep Operational Insights

Data is analyzed across multiple dimensions: driver performance, customer locations, order types, skill sets. The result? A complete operational performance picture.

Driver app check-in / check-out — smartphone showing scanned delivery confirmation and NEXT button for stop workflow

What Stop Duration Analysis Delivers

When enterprises understand what happens at each stop, the improvements are immediate.

10–18%productivity improvement across the delivery workforce
99.9%visibility into site-specific operational delays
Standardized service benchmarks across regions and teams
Accurate planning models based on real historical execution data
3 yearsof historical analytics for long-term optimization

In logistics, minutes compound into millions.

Legacy Tracking vs Modern Service Time Intelligence

CapabilityTraditional TrackingLogiNext Service Time Analytics
Data CollectionManual driver reportingApp-based automated capture
AccuracyApproximate time estimatesPrecise timestamp intervals
Planning ComparisonNot availablePlanned vs Actual variance
Operational InsightsTrip summaries onlyDriver, customer & skill insights
OptimizationReactive adjustmentsPredictive route improvements

This is the difference between tracking operations and optimizing them.

Where Service Time Analytics Drives the Biggest Impact

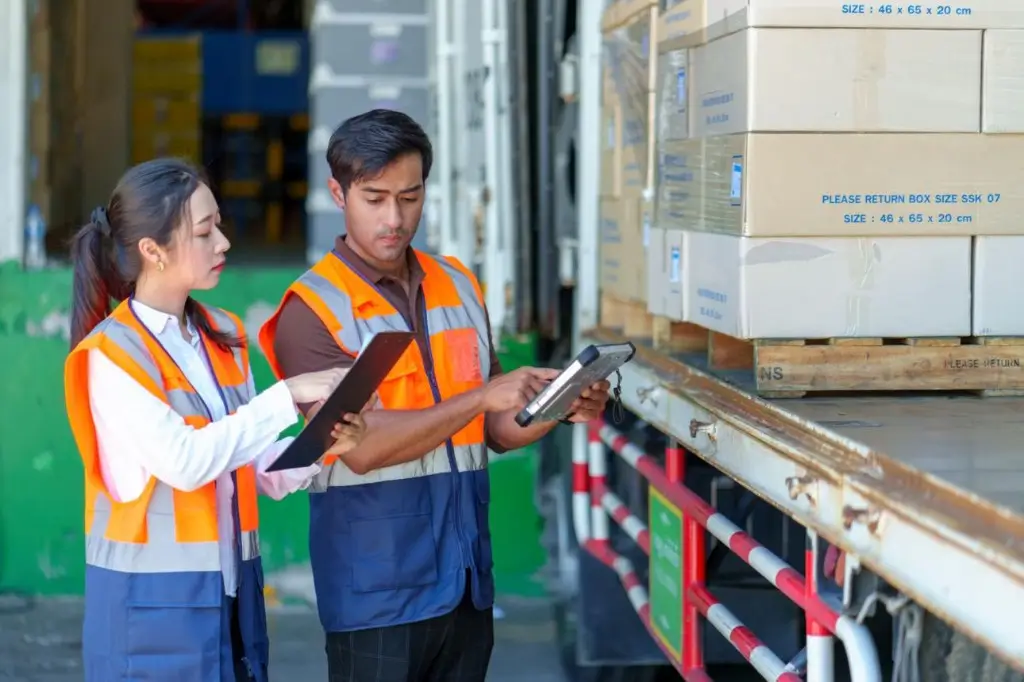
Delivery handover — driver and recipient exchanging packages at stop; service time is measured from check-in to check-out

Warehouse & Pickup Operations

Challenge

Unpredictable loading times delaying outbound routes.

Solution

Analyze pickup service durations at warehouse locations.

Outcome

Standardized loading cycles and faster dispatch.

Logistics operations at loading dock — workers with clipboard and tablet verifying inventory; truck with palletized boxes

Last-Mile Customer Experience

Challenge

Certain customer locations consistently taking longer.

Solution

Stop Duration Analysis highlights high-service-time customers.

Outcome

Smarter delivery windows and better customer expectations.

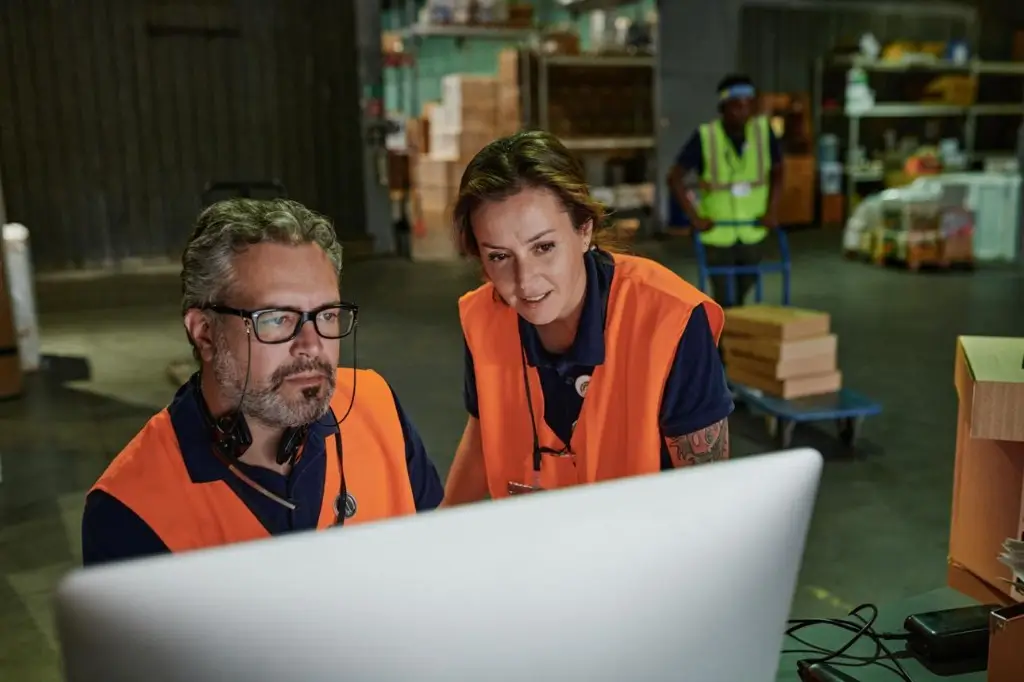
Specialized logistics — warehouse workers reviewing data on screen; operational management and inventory in logistics environment

Specialized Logistics Operations

Challenge

Technical installations or high-value cargo handling taking unpredictable time.

Solution

Analyze service time by Delivery Type and Skill Set.

Outcome

Better workforce allocation and accurate service pricing.

Operational Excellence Starts With Time Intelligence

The power of LogiNext's Service Time Analytics lies in exception-based management. You don't need to review every delivery stop. The system highlights outliers instantly—locations where service time exceeds expectations. From there, managers can:

  • Investigate root causes
  • Optimize route plans
  • Improve operational processes

And most importantly, turn historical insights into future efficiency.

Modernize Your Stop Efficiency Strategy

Your fleet already generates the data. LogiNext turns it into operational intelligence. Identify delays. Standardize performance. Optimize every stop.

Frequently Asked Questions

Service Time is measured as the interval between the Check-In swipe and the Delivery, Pickup, or Attempt confirmation in the LogiNext Driver.

Yes. LogiNext lets you evaluate service duration for individual locations across your network.

LogiNext's Service Time Analytics dashboard displays Actual Service Time vs Planned Service Time, allowing quick identification of execution gaps.

Yes. You can analyze data separately for Pickup and Delivery operations.

Absolutely. Service duration can be evaluated by Delivery Type or Skill Set, enabling accurate resource planning.

Modernize your stop efficiency strategy

LogiNext Trusted Worldwide

  • cargo-expreso
  • singapore-post
  • toyata
  • mgm-bosco
  • malta-post
  • lion-parcel
  • seven-eleven
  • target
  • lotus
  • marko
  • dmart
  • nestle
  • unilever
  • pg
  • heineken
  • coca-cola
  • true-value
  • danone
  • kfc
  • starbucks
  • burger-king
  • pizza-hut
  • taco-bell
  • baskin-robbin
  • papa-johns
  • dunkin-donuts
  • mondelez-international
  • mc-donalds
  • agility
  • apl-logistics
  • lf-logistics
  • mahindra-logistics
  • rsa-global